
insights
EVS Software Case Study: OhioHealth
OhioHealth System Creates Environmental Services Efficiencies with ES Optimizer
OhioHealth’s daunting facility metrics required an Environmental Services Software solution.
ES MANAGERS HAVE MORE TIME FOR QUALITY AND TRAINING
Long considered the cleanest facilities in our society, hospitals rely on their second largest work force, the Environmental Services (ES) Department, to maintain this essential hospital function. Second in size only to the nursing staff, the ES staff ensures patients and their loved ones are confident they’re in a clean and healthy environment. Hospital acquired infections (HAI’s), customer satisfaction, cleanliness perception, and discharge acuity all must be balanced with the front-line labor and management systems needed to excel in the modern hospital Environmental Services Department.
THE CHALLENGE FACING OHIOHEALTH
The ES Departments share the OhioHealth Mission: To improve the health of those they serve. Their goal is to consistently present a non-infectious facility cleaned by well-trained professionals.
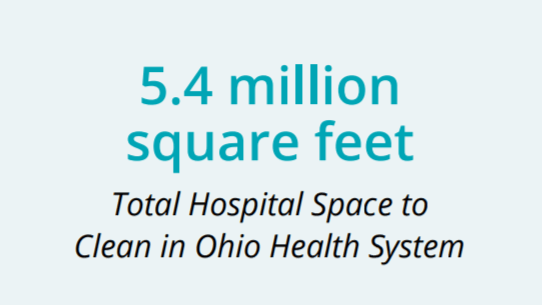
The challenge is the sheer size of the OhioHealth System. It is a family of 29,000 associates, physicians and volunteers; a network of 11 hospitals, 200+ ambulatory sites; and providers of hospice, home health, medical equipment and more, spanning 47 Ohio counties. Their hospitals are busy places. ES Managers were using spreadsheets and paper surveys to manage a staff of 650 charged with cleaning and inspecting 5.4 million square feet. The tools ES management teams were using to accomplish their mission had become outdated and time consuming with effectiveness being hit or miss.
The administrative burden of creating work assignments and staffing schedules kept managers from improving quality. It also hindered their ability to keep current assessments of the actual number of employees needed to maintain consistent levels of cleanliness. Standard industry benchmarks for number of employees, based solely on square footage, were telling management one story. But, actual quality inspections were telling another, resulting in customer satisfaction scores needing refinement.
THE SOLUTION
OhioHealth decided to work with Smart Facility Software, using the web-based software, ES Optimizer, to meet this challenge.
ES Optimizer is a system that streamlines every step in analyzing staffing needs, building work assignments and creating employee schedules. One OhioHealth hospital was chosen initially to pilot the software in January 2016: Grant Medical Center, in Columbus, OH — Ohio’s busiest Level I Trauma Center. Once the pilot was complete the project management team would bring back findings to determine whether ES Optimizer should be implemented system-wide.

How Frequency is Determined
Step 1:
Find out the true number of Full-Time Employees (FTEs) needed.
OhioHealth decided to go grassroots to find out how many people were needed for the level of cleaning quality desired.
Knowing the amount of space, tasks and frequency is the key to answering the FTE question. An inventory of the hospital’s rooms, corridors, elevators, stairwells, and entrances, with the cleaning tasks would be needed for each type of space. Then frequency would be determined: How many times per day/week/month/year are we going to perform each cleaning task?
OhioHealth used Smart Facility Software’s team of professionals to conduct the on-site inventories and enter the data into ES Optimizer. The
times needed for each cleaning step, already in ES Optimizer, are based on Smart Facility Software’s 30+ years of ES experience. OhioHealth, however, adjusted the cleaning steps and times to complete them to suit the unique needs of their facility. From there, the software calculated the number of FTEs actually needed. ES Managers were able to run what-if scenarios using the software to alter the number of FTEs required. For instance, they could change levels of cleaning and frequencies to see how the final numbers were affected.
Step 2:
After the appropriate staffing level had been determined, OhioHealth moved to implement. This meant building daily work assignments. ES Optimizer made it easy to turn the room inventories already in the database into working sets of assignments.
Step 3: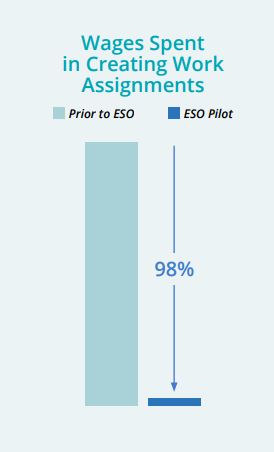
Staff were then appointed to the work assignments they would cover. Again, using ES Optimizer, the ES Manager could easily view work assignments that needed coverage and search the database for technicians with available time to cover it. If a technician had available time, the ES Manager could search the database for available work assignments. This made sure all work assignments are covered despite unexpected as well as expected time off.
On-site training sessions gave the ES management team the skill set to fully utilize all ES Optimizer capabilities: Staffing Analysis, Work Assignments, Quality Inspections, Employee Training, Project Work, Census Based Scheduling, and other vital components. The management teams could now get rid of all the paper, word documents, and spreadsheets.
THE RESULTS
The effect of implementing ES Optimizer in Grant Memorial Hospital impacted staff, management, and customers decisively.
ES Managers at Grant eliminated the equivalent of 12 hours per pay period of administrative work. This represents an 83% decrease in managerial labor cost spent on administrative work. The labor expense for management to generate a new work assignment was reduced by an astounding 98%. The newly freed up hours were reallocated to customer service rounding of the hospital.
There was a 75% reduction in the ES manager’s hours spent on interim management duties. This allowed the majority of their time to be directed to customer service rounding and associate coaching.
“Surprise” service requests for areas not being covered that take the schedule off-track are a thing of the past.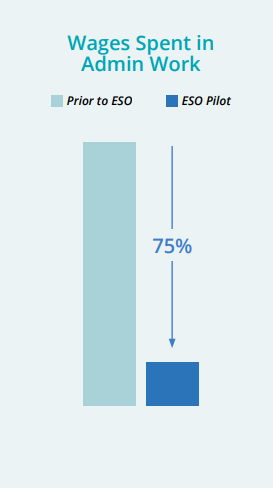
The project management team concluded that if ES Optimizer were implemented system-wide, new leaders will benefit from fast onboarding due to the automated administrative processes. This would result in significant improvement in new leader workflow design.
APPROVAL TO ROLL OUT SYSTEM-WIDE
With these results, the project team received approval to implement ES Optimizer system-wide to include all their Central,
Ohio and regional campuses.
As ES Optimizer was rolled out across the system, Managers and Service Techs saw immediate feedback and improvement via quality inspections (which could be easily performed on ES Optimizer’s mobile app). New work assignments made discharge cleaning the priority. Trends for Quality improvement became easy to report on. Staff observed a rapid improvement in day-to-day cleaning as well as project cycle cleaning.
ES Optimizer has made OhioHealth Hospitals cleaner in not only perception but in reality, instilling confidence the Environmental Services Departments are making the most efficient use of the labor resources available.
LEARN MORE ABOUT SMART FACILITY SOFTWARE
Founded in 1986, SFS is considered the industry expert for in Environmental Services Management and Technology. Our web-based software products include:
| The Industry’s Premier Software used by over 750 Hospital ES Departments Every Day. | The Mobile Add-on that connects ES Technicians to ES Optimizer’s Task Management Application. | The Software to Easily Build and Conduct Any Survey, Anytime, Anywhere. |
Download and print a PDF of the OhioHealth System case study here.