
insights
Get Accurate, Comprehensive EVS Staffing Levels
A Site Inventory: The Advantages of Having Your Actual and Unique Facility Data
Most EVS Directors have experienced this phenomenon:
A staffing analysis benchmarking report comes back with the potential for significant savings—if its recommendations are successfully implemented. But in practice, you may have noticed your team struggling to implement those changes without sacrificing quality or service level. EVS Directors commonly grapple with rising HAI rates—needing to balance thorough cleaning with financial and staffing limitations. That’s why it’s so important to base decision making on good data. When it comes to staffing analysis, the difference between what’s theoretically possible and what’s actually doable comes down to basing reports on your facility’s actual data and unique EVS program. Actual data—obtainable by conducting a site inventory (also known as a cleanable space inventory)—improves the accuracy of any staffing analysis.

Of the approximately 6,000 hospitals in the United States, square footage spans a broad range. The total average square footage in 2023 was 356,000 square feet. Facilities with fewer than 100 beds averaged under 200,000 square feet, while the largest facilities, with over 250 beds, averaged 1.1 million square feet. The remaining facilities, with 101 to 250 beds, averaged 444,000 square feet.¹
¹Definitive Healthcare
The Theory of Benchmarking
Staffing analyses that rely on benchmarking compare data sets from multiple facilities and use averages to prescribe the level of EVS staff needed per square foot. This can be useful, in terms of providing a sense of industry norms.
But averages are just that: many facilities have higher staffing levels, and many have lower levels, based on the unique situation in those facilities. And it’s not just square footage that affects those staffing levels.
The Limit of Benchmarking
Multiple factors affect staffing levels beyond just square footage, such as:
- Type of space (what is the mix of office space, ERs, ORs, patient rooms, waiting rooms, etc.)
- The volume of patient room discharges and transfer cleans;
- Patient room census occupancy;
- Management team-to-employee ratios, as well as the specific responsibilities of the management team;
- Public area policing and porter duties (service request responses);
- Paid break time per shift;
- The amount of lock-in areas cleaned, such as ER, L&D, NICU, Invasive Radiology, Surgeries, Cath Labs, etc. — areas
that need multi-shift EVS attention due to cleaning between cases, or constant turnover; - Volume of non-cleaning tasks: such as meeting set-ups or supply room stocking.
An Example of Square Footage Comparisons
If, for instance, there are two facilities that both have the same square footage, but one of them has twice the amount of patient rooms, that facility will inevitably need more employee hours to reach the same quality of service and cleaning. And while some factors are accounted for in benchmarking numbers, the factors vary widely by facility, and controlling for all of them is difficult.
Apples to Apples?
There are also other variables to consider when it comes to benchmarking. As with any analysis, you have to make sure that you’re comparing apples to apples.
Here are some of the questions that a hospital should consider before using benchmarking for EVS staffing levels:
Are the facilities in a benchmarking report similar to your
own facility? You want to be sure that the facilities a report is based on are similar to your own when it comes to the
factors listed above.
Do these facilities achieve the level of cleanliness that your facility aspires to have? The average HCAHPS rating among US hospitals for cleanliness is 3 out of 5 stars.
Are the facilities understaffed? The trend in most facilities over time has been continually decreased staffing in response to hospital budget cuts. Some hospitals in benchmarking studies, therefore, are operating understaffed and could produce artificially low expectations for the hours needed to maintain quality in your facility.
Adding Actual Data to Benchmarking
Creating a facility’s Cleanable Space Inventory requires actually walking the space to take and document laser measurements of cleanable areas, while noting the type of space and general procedures associated with each measurement.
A facility’s unique variables
A staffing analysis based on an actual facility, rather than only benchmarking averages, provides answers for the actual criteria in the categories mentioned above: Managerial to staff ratios, operational data such as OR cases and discharge volume, and the unique circumstances regarding lock-ins or tasks such linen distribution and supply room stocking. Most important, the fundamental piece of actual data is the measurement of the actual, unique space. This measurement is referred to as the Cleanable Space Inventory or Site Inventory.
Cleanable Space Inventory:
The Core of an Accurate Database for Your Unique Facility
At its core, ES Optimizer is an inventory of every cleanable space of a unique facility, with cleaning metrics for each room. Instead of a model based only on benchmarked standards, the database contains actual and unique sets of floors, rooms, and cleanable spaces.
Staffing data by Rooms, Buildings, Floors, Areas
Rooms are organized by buildings, floors, areas, assigned tasks, and cleaning frequencies.
Vital Cleaning Metrics by Room Type
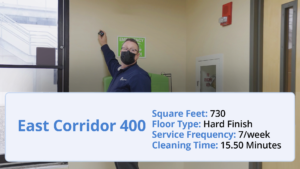
Vital cleaning metrics are assigned to each room by room type, square footage/units, floor surface, and cleaning steps.
Cleaning Times and Task Frequencies
Cleaning times and task frequencies for each room are easily viewed and adjusted.

A completed Cleanable Space Inventory will breakdown the space by building, floor, subsection and specific areas such as rooms.
Walking the space, first hand
A Cleanable Space Inventory is created by literally walking the floors of a hospital facility to determine its scope and specific needs. Each facility’s database captures not only its square footage, but also factors like the type of space, fixtures in that space, and acuity.
Add up every variable
Including a Cleanable Space Inventory
When a staffing analysis also takes into account your facility’s Cleanable Space Inventory and other specific EVS cleaning protocols, variables and tasks [such as lock-ins, waste removal, and non-productive time], a facility’s staffing analysis achieves the greatest accuracy. Managers can build work assignments that meet the needs of a unique facility and budget.
Budgeting A Staffing Analysis Based On Actual Facility Data
Figuring your investment
How much investment is required to add actual facility data to your staffing analysis? For the Cleanable Space Inventory component only, the general rule of thumb is an efficient $175 for every 10,000 square feet. Of course, because our topic here is stressing the uniqueness of each facility, Smart Facility Software can provide a more accurate estimate for the total cost of collecting actual data by asking you for some initial facility details. Contact us at 800–260-8665 or at Info@smartfacilitysoftware.com. We’re happy to get the unique answers for your specific facility.