insights
Is my hospital average?
The likely answer is “no,” says the data.
BROAD RANGES IN FACILITY DATA SUGGEST THERE’S NO SUCH THING AS AN AVERAGE HOSPITAL
Over 500 Different Apples
In an effort to test the predictability of EVS staffing levels based on the square footage of hospitals by room types, we analyzed actual facility data and EVS hours for over 500 hospitals, seeking apples-to-apples comparisons.
Turns out, there are no apples. Just over 500 different hospitals.
Specifically, broad ranges in SPACE allocation and cleaning HOURS per square foot
make staffing level predictions based on square footages inaccurate.
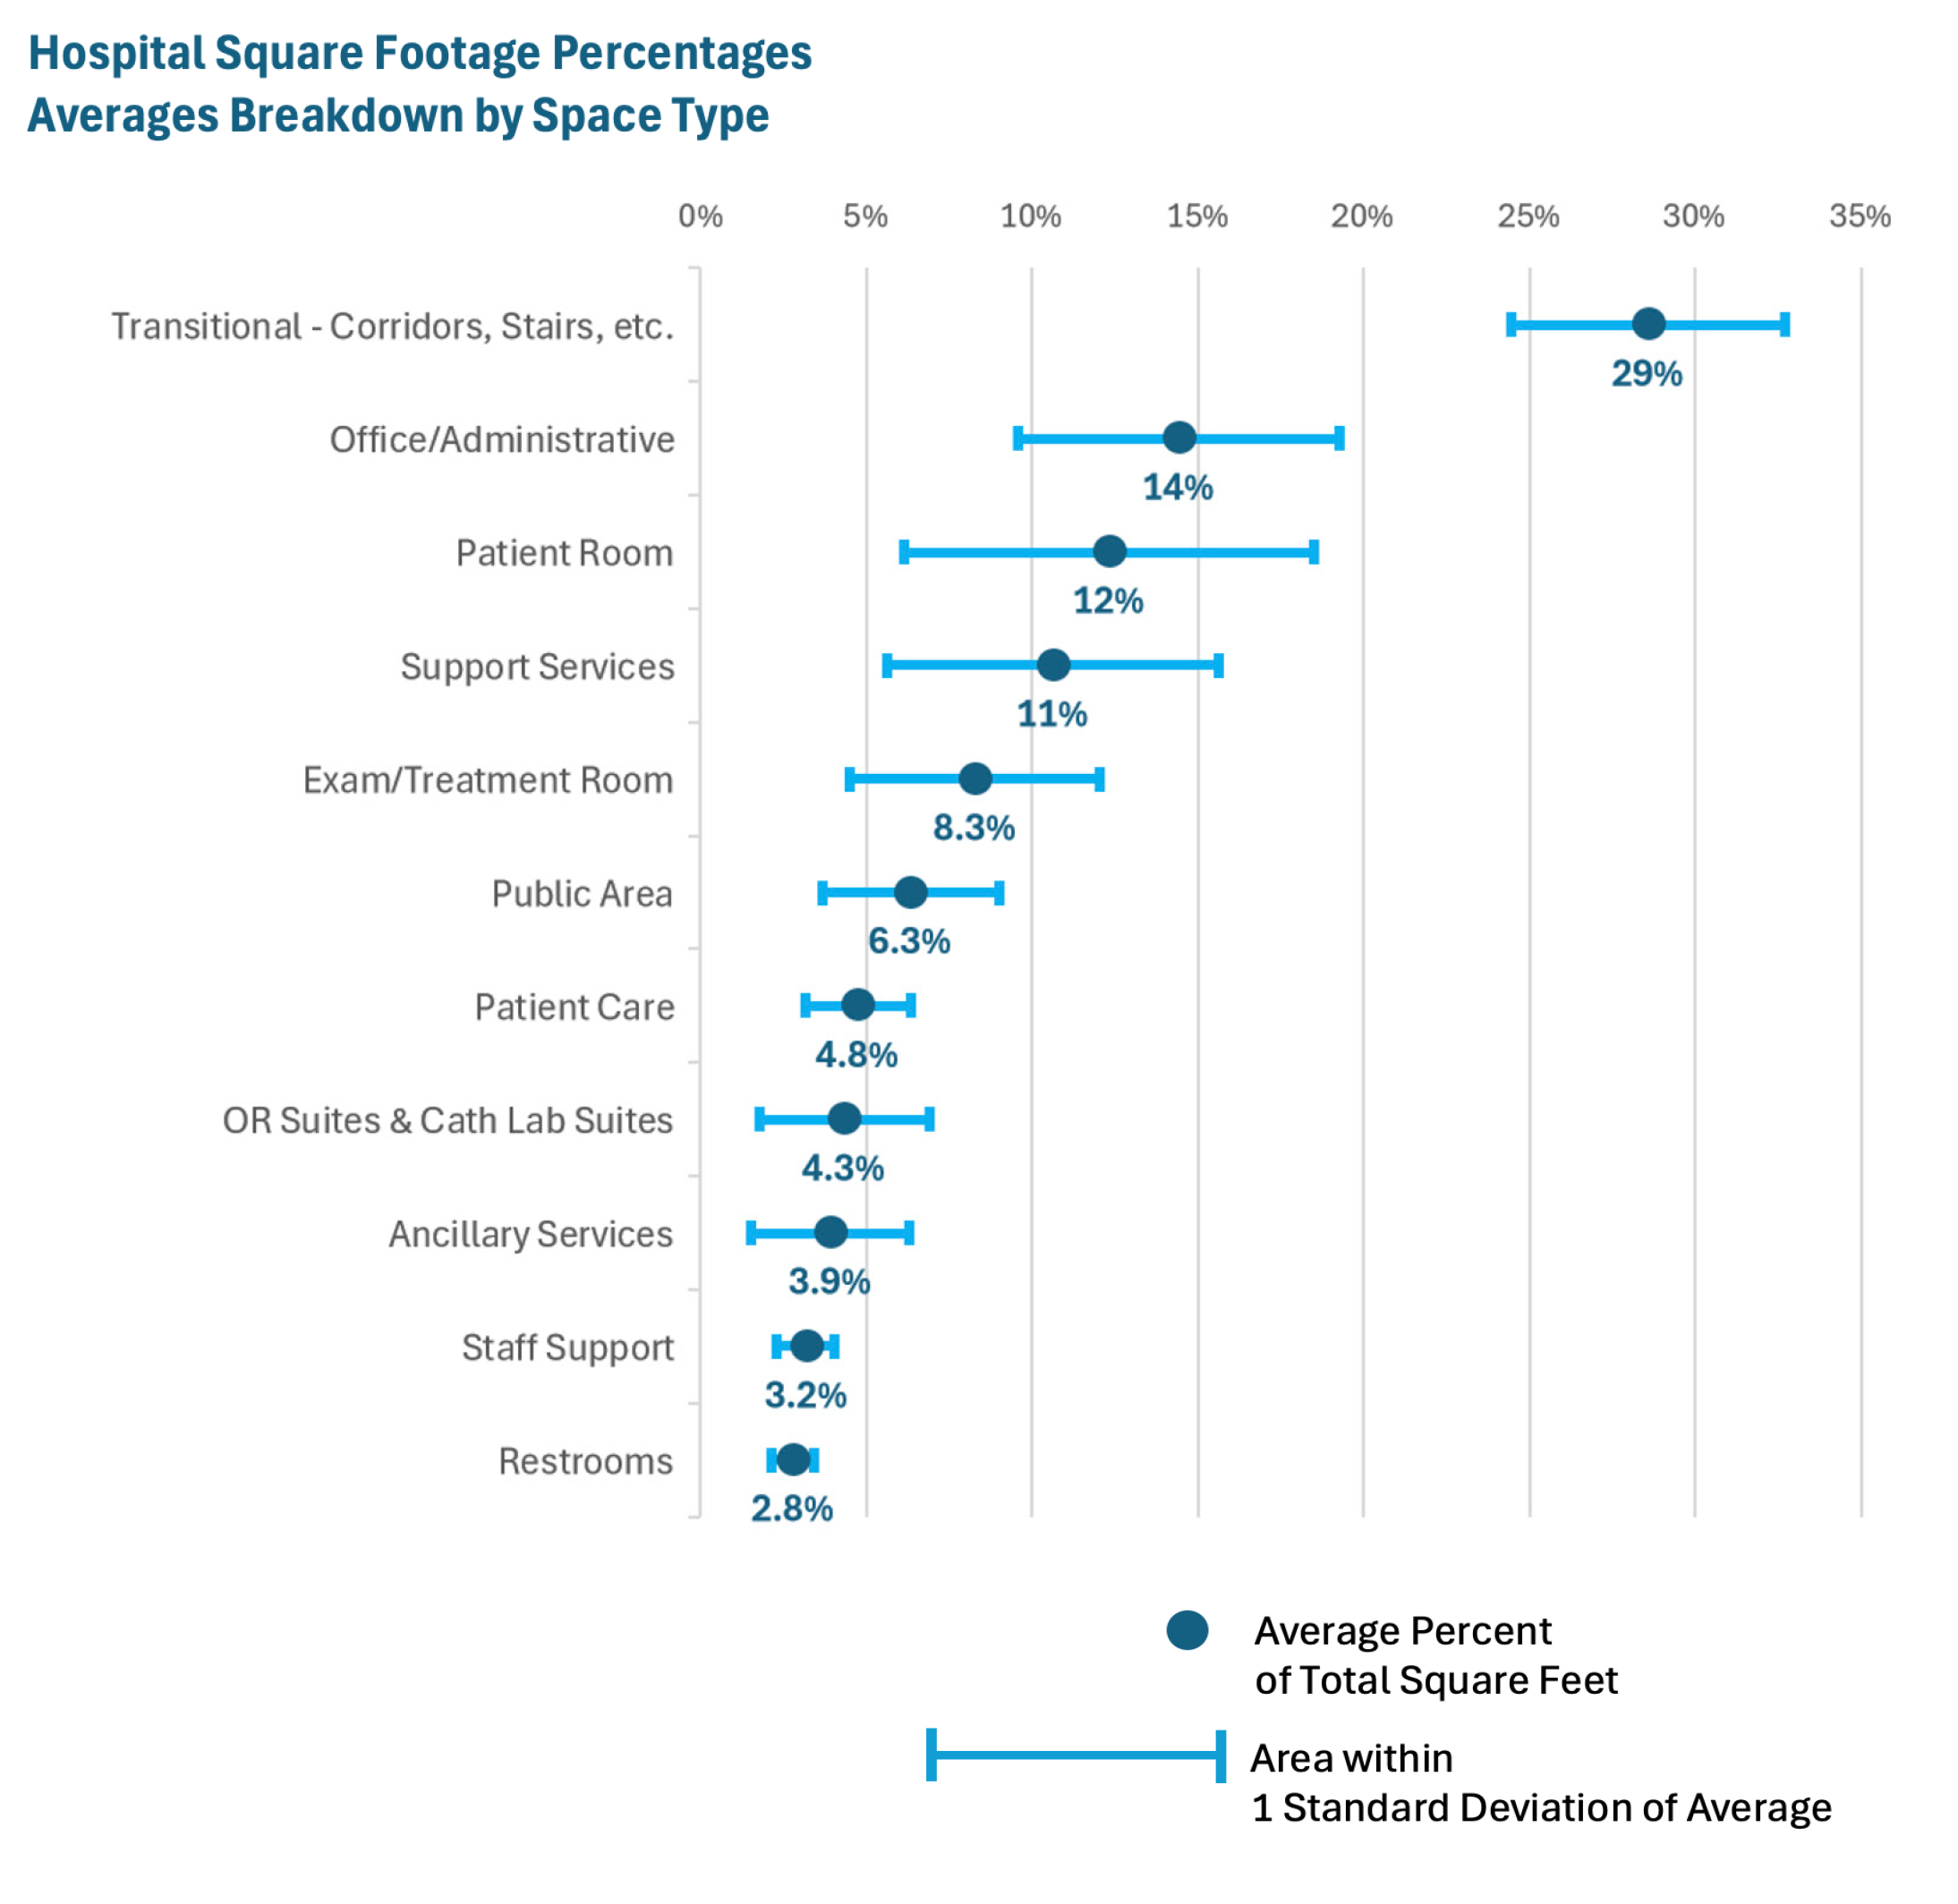
This article will show the percent of square feet allotted to key SPACE types, on average, in our sample.
It will first reveal the broad ranges around those averages. Then, we continue by adding the ranges in cleaning HOURS per square foot.
Finally, when those two ranges are combined, the result is wildly ranging staffing predictions.
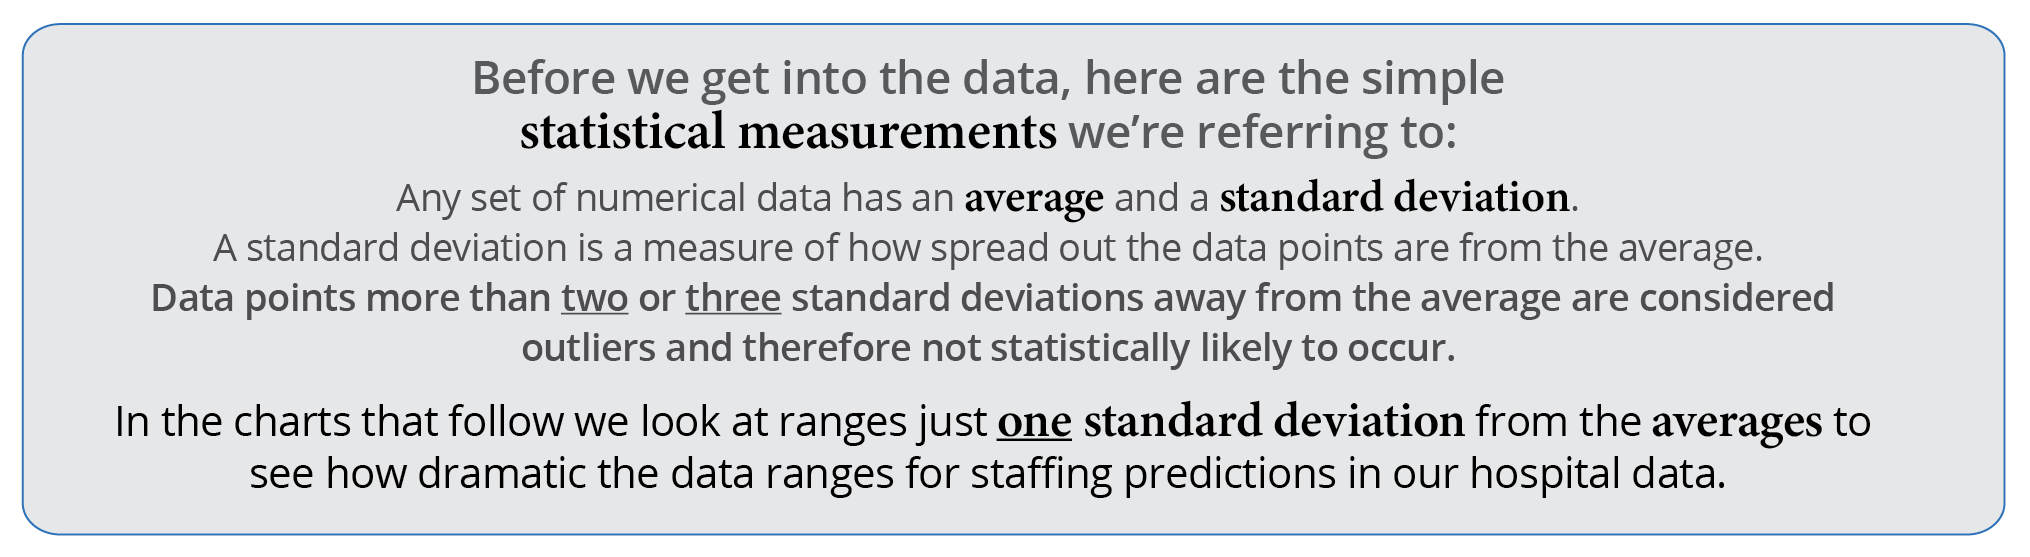
The simplest way to look at this is by looking at
average square feet of Clinical Space vs Non-Clinical Space.
That’s where we begin.
Clinical Space vs Non-Clinical Space:
According to our data set, hospitals average
34% of their square footage in Clinical Space
and 66% in Non-Clinical Space. Clinical Spaces include room types such as patient rooms, exam rooms, ORs…anything related to clinical activities. Non-clinical spaces include offices, conference rooms, corridors, waiting rooms and so on.
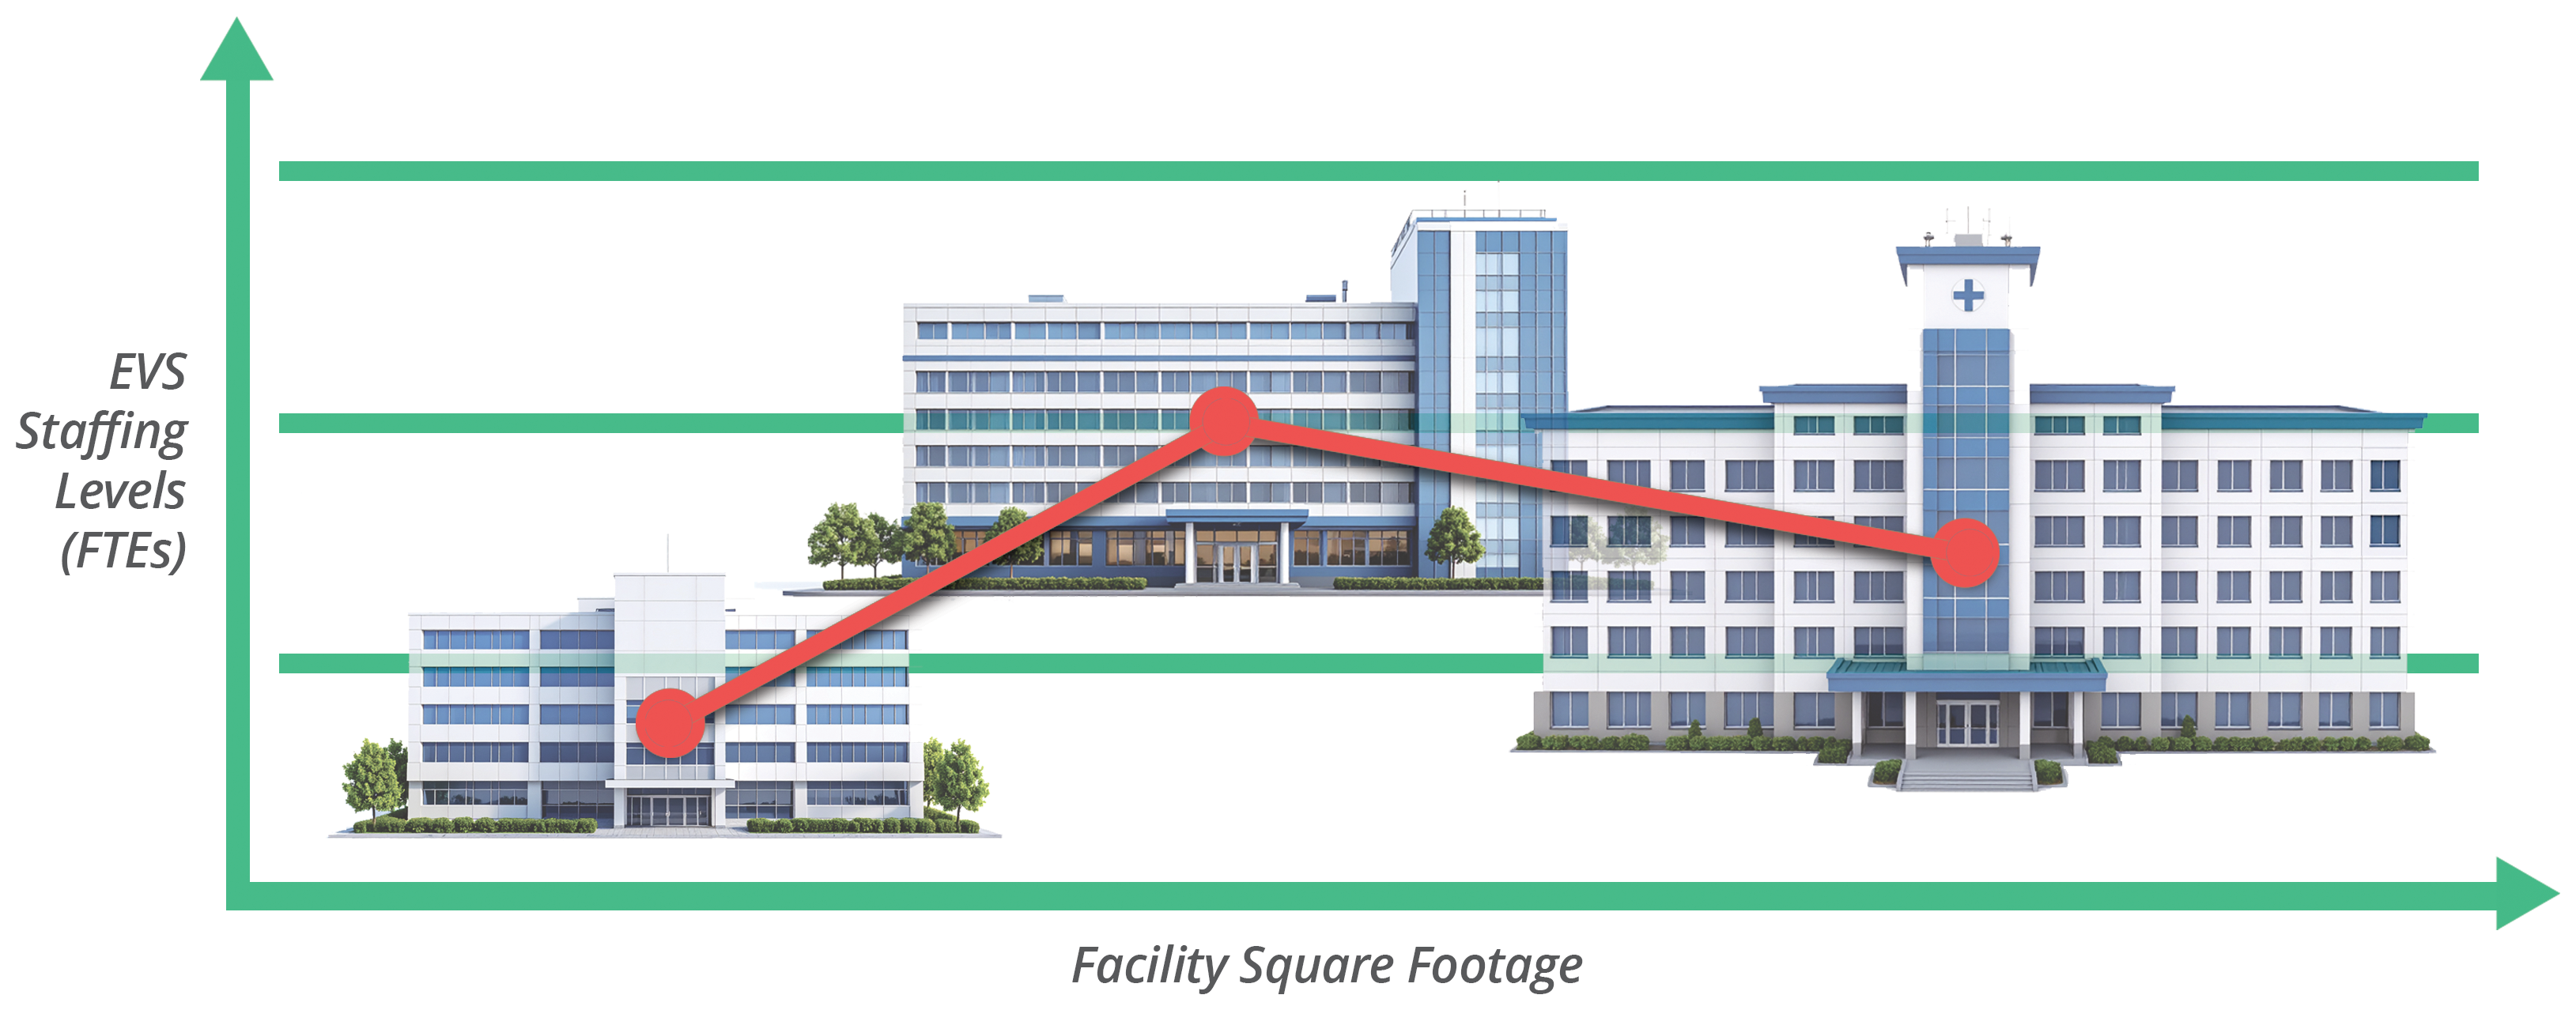
Apply cleaning hours
to get staffing levels (FTEs).
We measure staffing levels in Full-Time Equivalent Employees (FTEs). One FTE = 2080* annual hours.
(*using a 40-hour week)
On average, our data shows that 1,000 square
feet of clinical space takes 723 hours annually (.35 FTE) to clean.
1,000 square feet of non-clinical space takes on average 168 hours annually (.08 FTE) to clean.
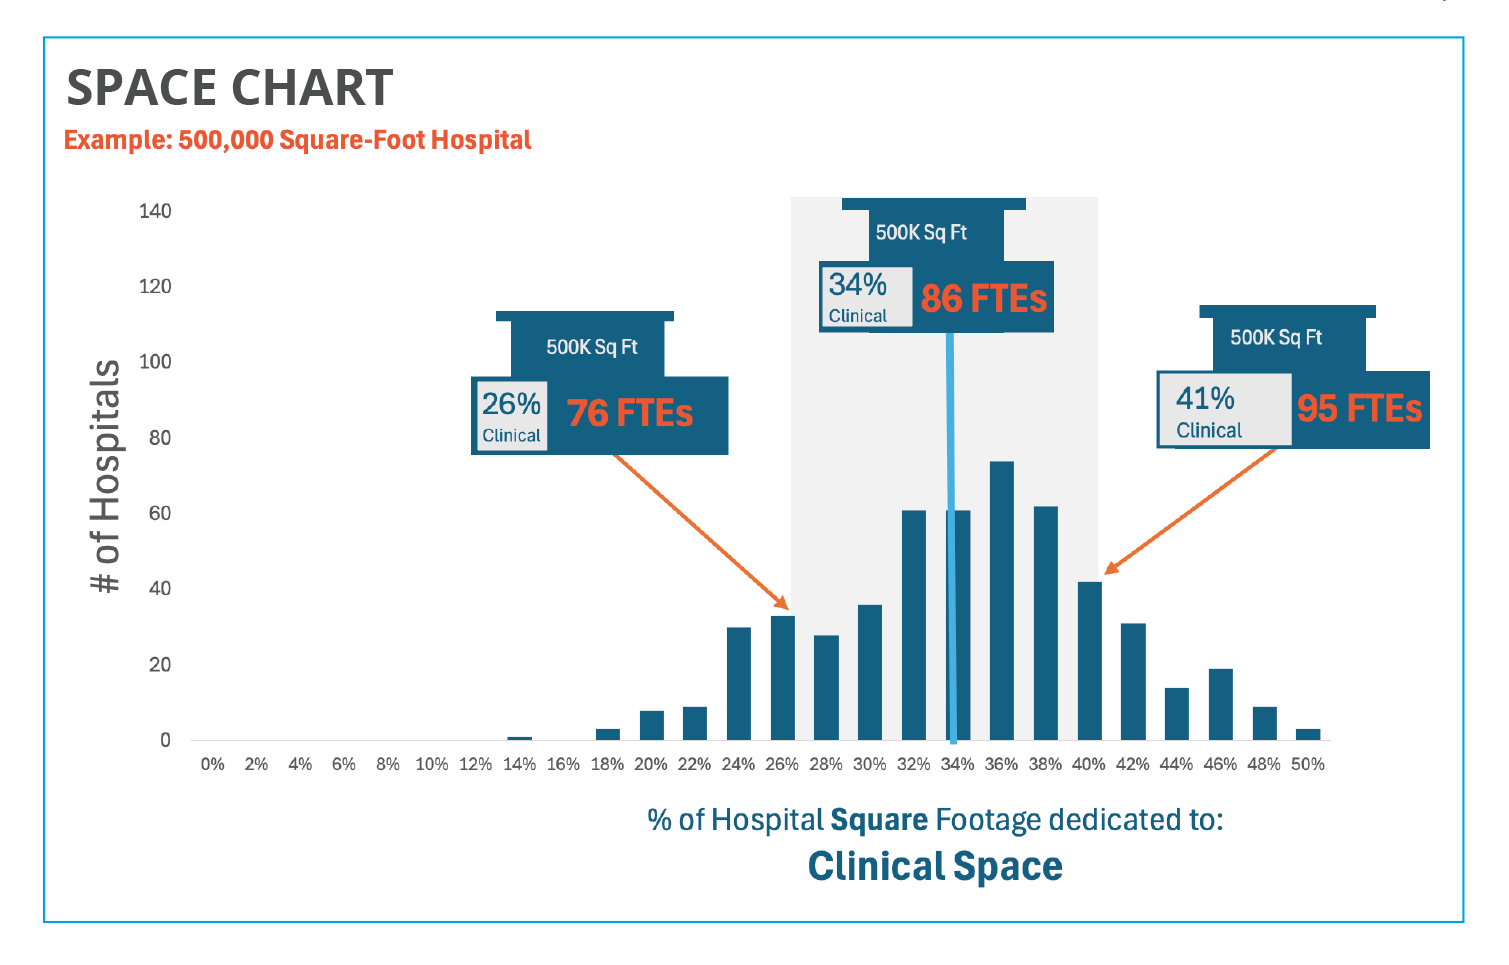
So, for example: A 500,000 Square-Foot Hospital:
If the hospital is average (34% clinical & 66% non-clinical), 86 FTEs are needed to clean the entire facility.
But, if your facility is just one standard deviation below average (at 26% clinical space), 76 FTEs are needed. At 41% clinical
space (one standard deviation above), 95 FTEs are needed. Statistically, this is a moderate variation. In reality, it’s a
potential of being off by a significant 19 FTEs in staffing calculations. And, that’s not the whole story. See below.
We continue by looking, also, at cleaning hours per square foot.
Cleaning hours per square foot also vary:
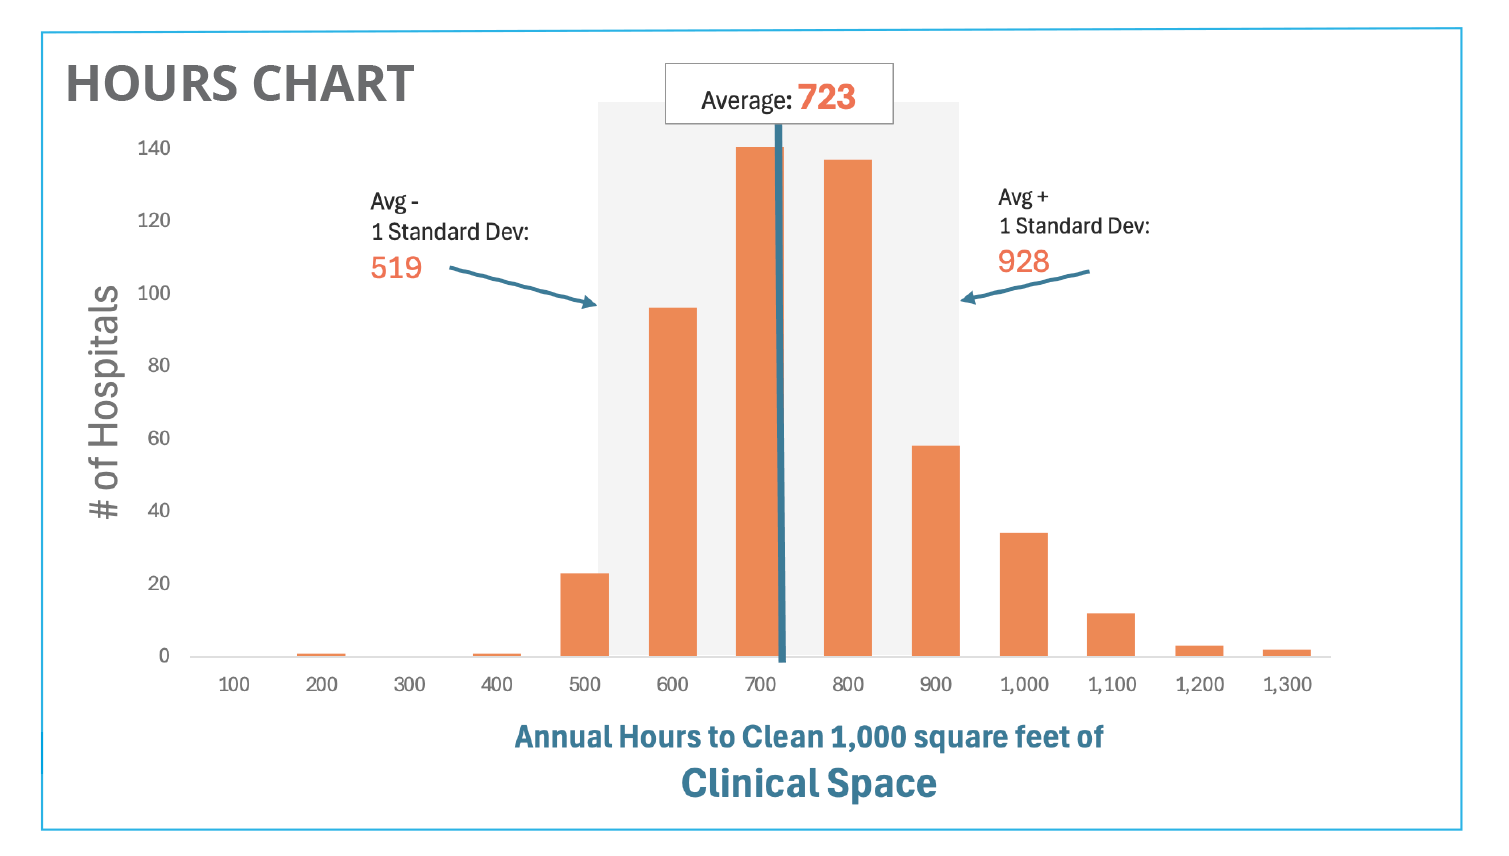
The SPACE chart example above assumes the hospital takes the average amount of time to clean 1,000 square feet of clinical space (723 hours or .35 FTEs). But, the number of hours needed to clean the same type and amount of space also differ across hospitals. The HOURS chart at right shows that just one standard deviation below the average is 519 annual hours. One standard deviation above is 928 hours. Differences in caseload, services offered, population served, and number of visitors all affect the range of this number, even among hospitals with similar space type allocations.
Then we combine the variation of SPACE type with the variation of HOURS per square foot.
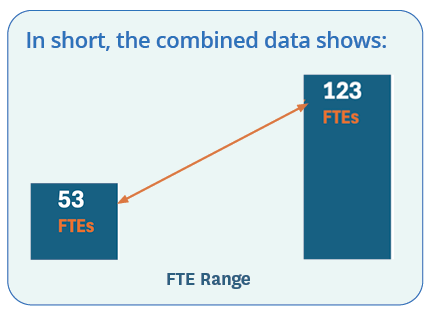
Compounding the SPACE and HOURS charts
(two moderate variations) creates an even larger FTE range: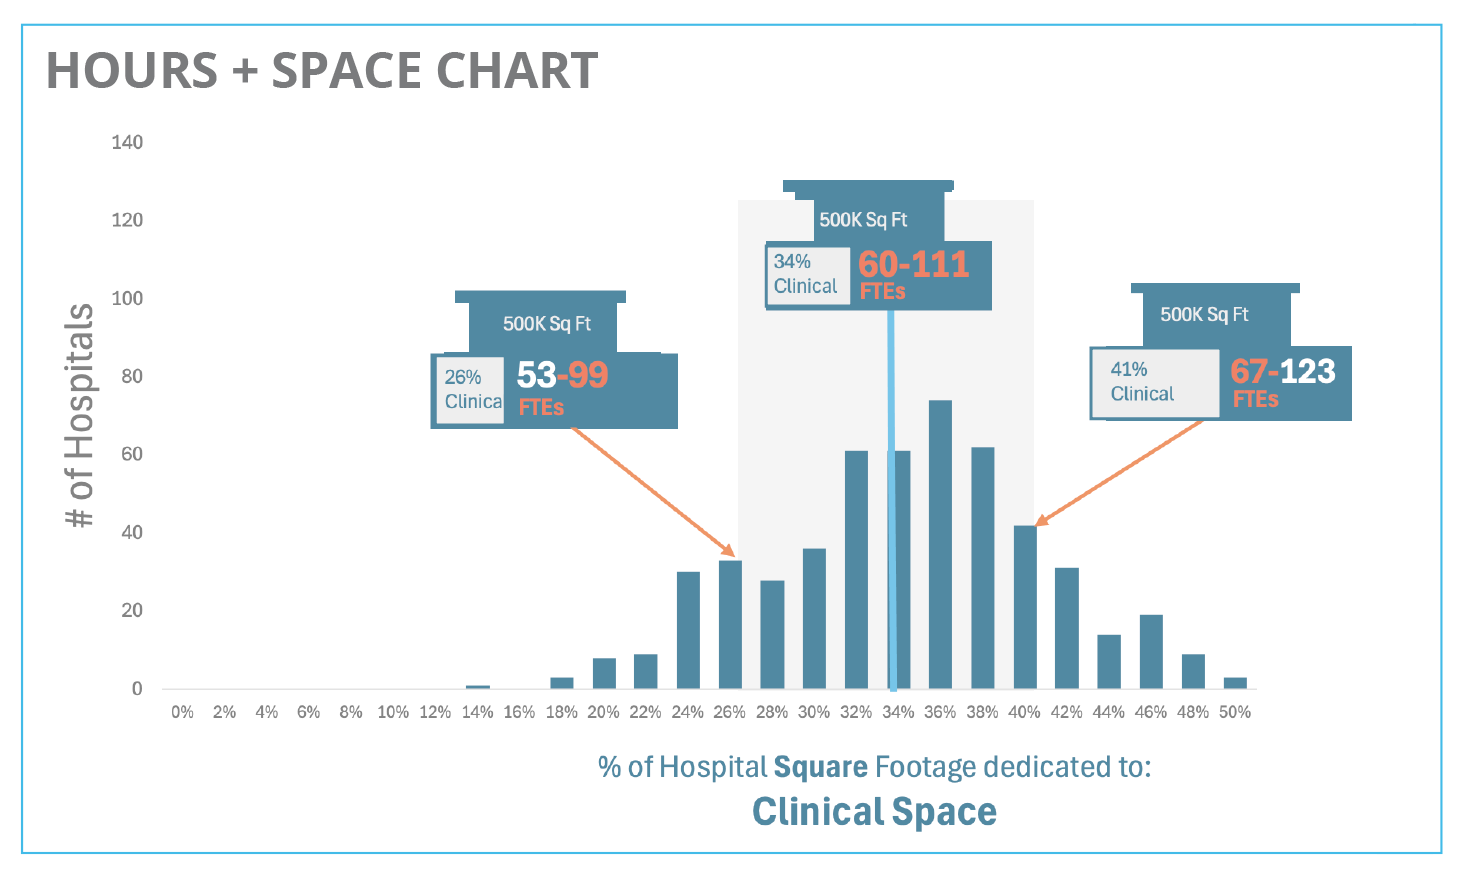
When taken together, the two ranges in the SPACE and HOURS charts combine to reveal an even broader range of plausible staffing levels: 53 FTEs to 123 FTEs, as shown in the chart at right.
CONCLUSION
A 500,000 square-foot hospital could need anywhere from 53 to 123 EVS FTEs. Broad ranges in facility space by type — and cleaning hours per square foot — mean that staffing level estimations based on square footage and space type breakdowns are not predictive. Turns out, when looking for apples-to-apples predictive comparisons in our sample data there are no average apples. Just over 500 different hospitals.
A better approach.
Get your facility’s actual and unique data — a site inventory.
There’s a better approach to accurately predict and determine EVS staffing level requirements.
It’s a specific approach for your hospital that doesn’t rely on averages and broad comparisons. It’s known as a site inventory.
Site inventory and staffing analysis by Smart Facility Software.
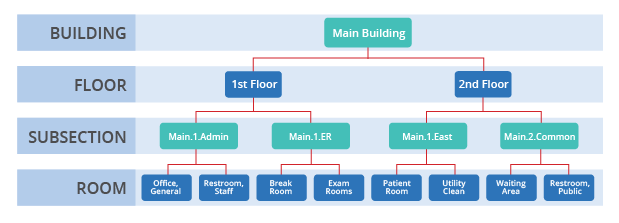
A site inventory by Smart Facility Software records every cleanable space of your facility, with cleaning metrics for each room,
organizing them by building, floor and subsection. The data we collect is housed in your own database where you can easily access it to run staffing analyses, build work assignments, and more. Our site inventory services and database software are used by
hundreds of healthcare facilities across the United States.
Measurements include, for example, unique room type, floor type, units, and square footage. Plus, metrics go even further, to include unique workload, patient population, services, and operational demands. These combined criteria give the true, clear picture of your facility’s actual workload — including standardized cleaning rates for 93 room types, customized to your hospital’s makeup. To date, we have measured over 1 billion square feet
Over 1 billion square feet measured — 1.5 times the size of Manhattan.
By now, we’ve measured over 1 billion square feet of healthcare space in the U.S.
Hundreds of EVS departments rely on actual facility data from Smart Facility to make accurate staffing predictions based on a variety of what-if scenarios.
From the industry’s leading EVS Management Software.
Ask us how your EVS department can begin a site inventory. Our data specialists use advanced technology to survey and log all of the cleanable spaces in your facility. By surveying each individual room, you will obtain a total cleaning picture of your facility, which will serve as the foundation for ES Optimizer functions going forward. We use laser measuring devices, workable floor plans, laptop computers and our professional expertise to get the job done quickly and accurately.
Want to learn more?
Contact us to talk about your facility’s site inventory.
info@smartfacilitysoftware.com.
800–260-8665, Option 1
APPENDIX
See additional granular breakdowns of hospital space types in the charts below.
APPENDIX Chart #1 (Shown in the article above as SPACE CHART)

APPENDIX Chart #2 (Shown in the article above as HOURS CHART)

Annual Hours include daily cleaning, project work, between case cleans (lockins), discharges & transfers, trash & linen removal, etc.
APPENDIX Chart #3

APPENDIX Chart #4

APPENDIX Chart #5

APPENDIX Chart #6

APPENDIX Chart #7