
insights
New! Dashboards
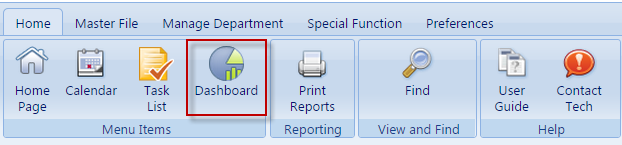
The Dashboard can be accessed from the “Dashboard” Button on the “Home” page. A dashboard is a management tool that measures and presents critical data on the key business performance areas in a summarised manner much like a car dashboard, so the management can quickly respond with appropriate decisions.
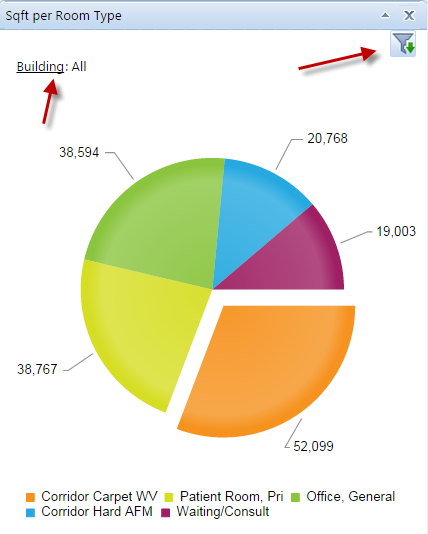
You will then see a group of nine (9) dashboards on the main screen. Here is an example of one of them. You can also filter the results by adjusting where the red arrows point.
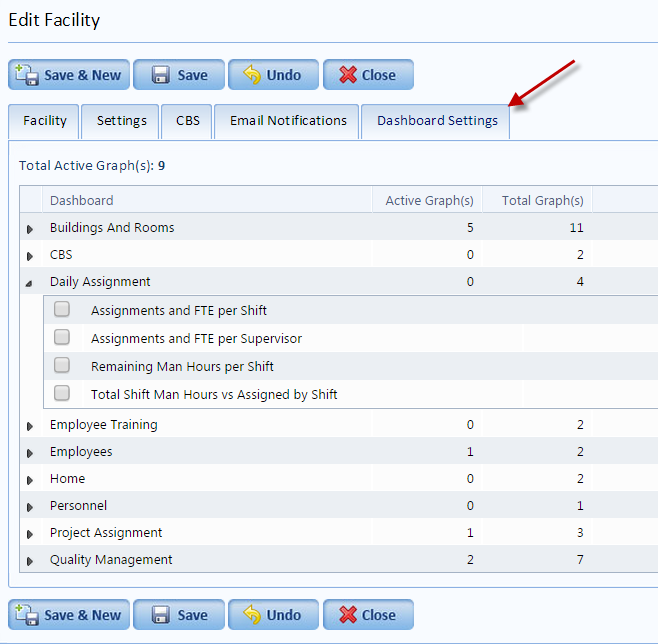
Graphs are divided into 9 sections and there are 34 active dashboards you can choose to display as one of you 9 active ones.
- Buildings and Rooms
- CBS
- Daily Assignment
- Employee Training
- Employees
- Home
- Personnel
- Project Assignment
- Quality Management
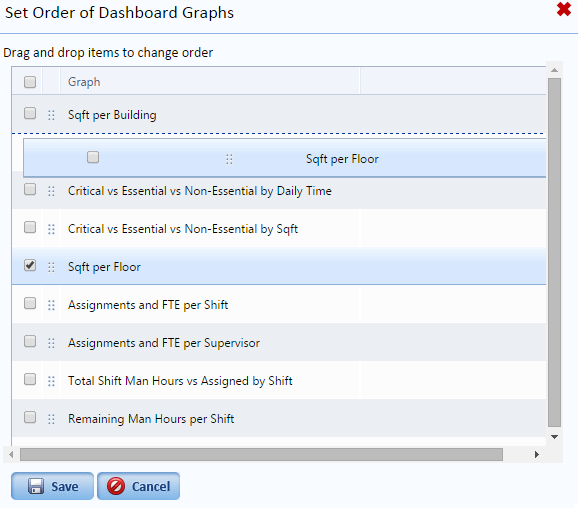
To configure the dashboards display go to Preferences>Facility and click on the “Set Graph Order” Button
To configure the dashboards display go to Preferences>Facility and click on the “Set Graph Order” Button.
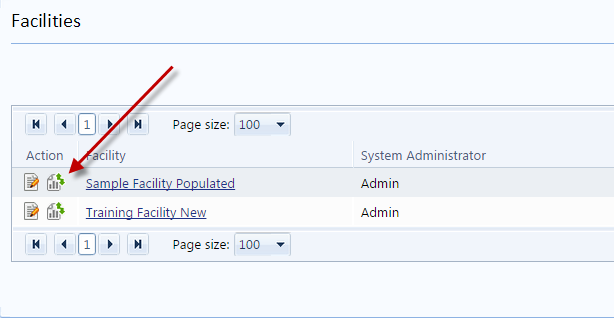
Then you are allowed to reorder the displayed dashboards.
Remember to keep you eye on the dashboard for successful Environmental Services management.