Home > Software Capabilities > Mobile Cleaning Inspections
Dashboards & Reporting
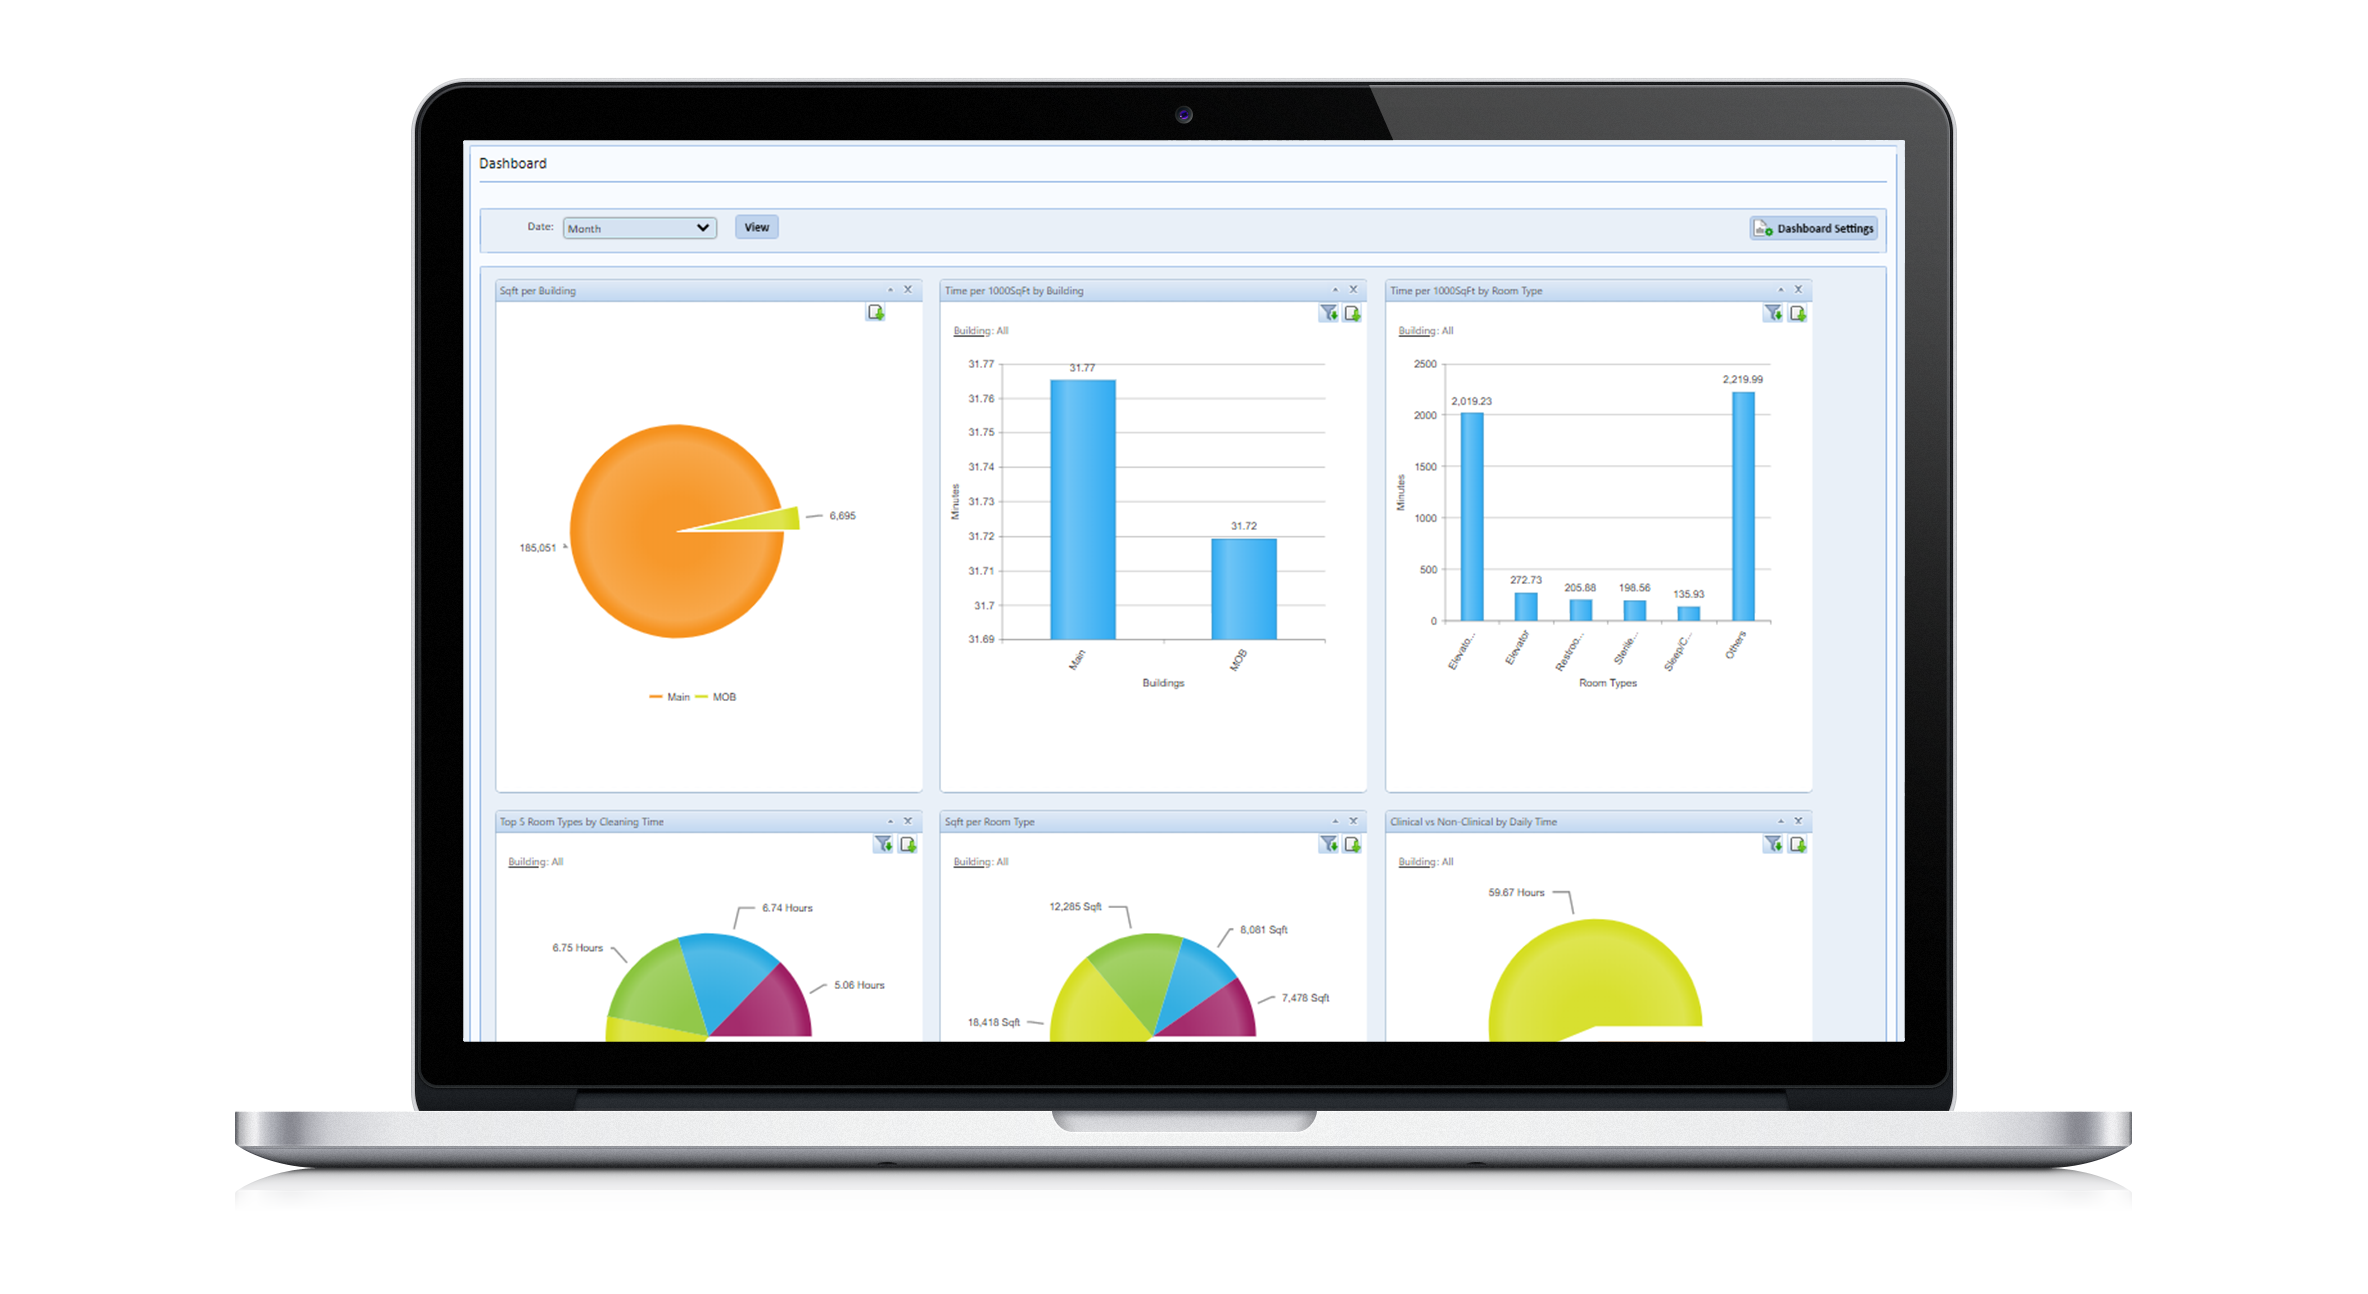
The hospital operations dashboard showing EVS impact.
Pre-built & customizable setups — visualize, allocate, and report. Managers can visualize cleaning service requests and assignment status in real time. It’s an EVS performance dashboard that can be used to allocate resources on the spot, or to generate detailed reports based on selected time periods and multiple criteria.
Request a Demo:
See Dashboards &
Reporting in Action

1. Choose from pre-built or custom dashboards
Departmental management statistics include:
Room inventory, cleaning times, employees per shift, project work completed, and cleaning inspection results.
2. View real-time metrics
Allocate resources on the fly. View:
Percentage of patient beds cleaned, total rooms cleaned by technician, total tasks completed by technician, restroom comments (paper products out), duty completion for the day.
3. Manage survey and cleaning inspection performance
Report the number of inspection surveys completed, and show:
Passing rates vs. failing rates by survey, average score, number of faults — generated vs. resolved.

Daily reporting at a glance — display up to nine charts at a time, including:
- Percent Completion Rate
For Scheduled Assignments - Percent of Patient
Beds Cleaned - Total Tasks Completed
by Technician - Public Space
Policing - Cleaning
by Square Feet - Top 5 Room Types
by Cleaning Times - Project
Work Completed - Cleaning
Inspections - Employees
Per Shift
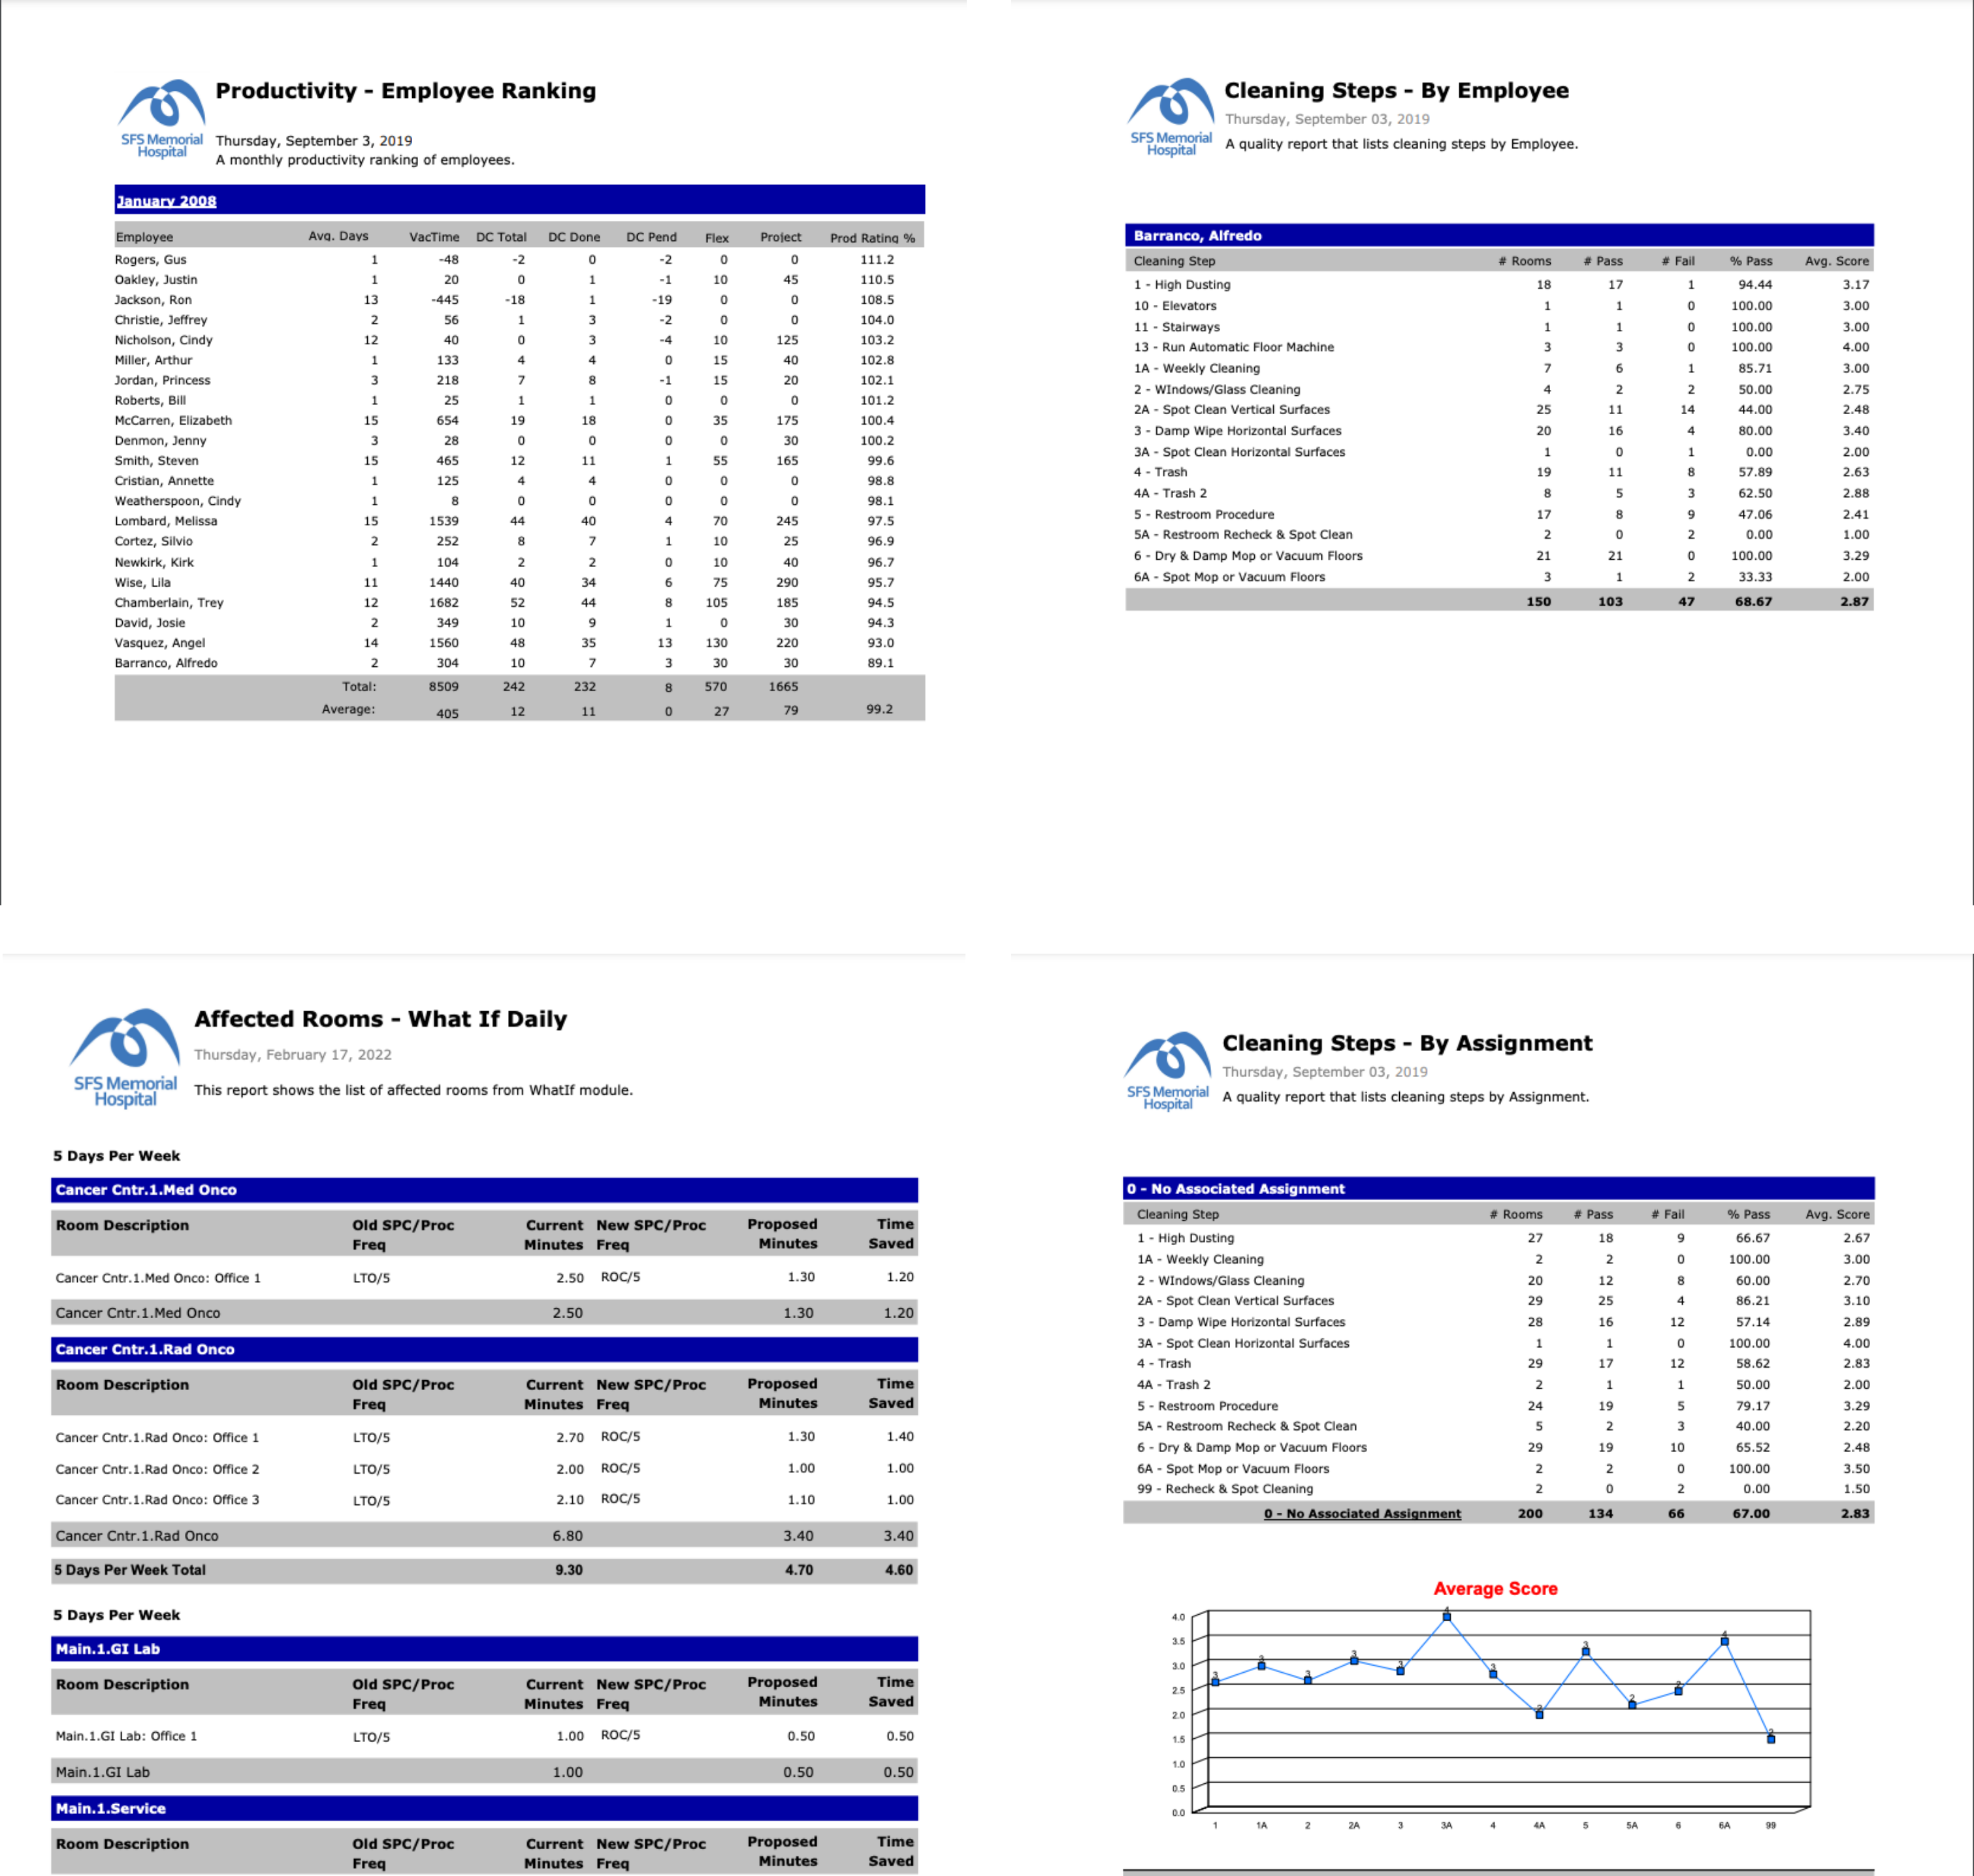
4. Choose from over 200 EVS reports with multiple filter options
Report in multiple ways:
• Cleaning Data • Employee Training Reports • Export Daily Work Assignments • Productivity Reporting • Project Work Orders • Cleaning Compliance • Policing History
Export reports:
PDF, Excel, CSV, RTF, XML, or Word. Print, export, or email.
• View sample reports from nine categories.
Click here to view a sampling of EVS performance modules/forms in nine categories, along with a one-line description of each report.

See our EVS software in action.

Smart Facility at CarolinaEast

Visible, Real-Time Communications

